Outputs
Component 1
Assessment and mapping of salinity-affected agricultural areas, and selection of areas for project implementation.
Salinity Maps
The salinity was derived using recent Landsat 8 tiles from dry months. The outputs were categorized nominally by their degree of severity.
The analysis was conducted by staff at the International Center for Biosaline Agriculture (ICBA) in May 2019.


Vulnerability Maps
The maps assess the exposure of the agricultural sector to extreme climate events, including droughts, floods, and heat waves. The outputs were calculated using climate indices derived from 21 models downscaled to 25km resolution covering two climate scenarios (RCP4.5 and RCP8.5) and different periods in the future. The exposure risks are categorized into 3 categories 'low, medium and high'.


Reports

Component 2
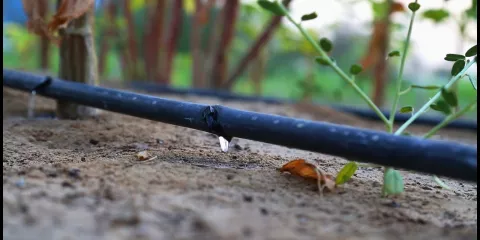
Participatory development of improved salinity management technologies and practices at Best Practice Hubs and related capacity building.
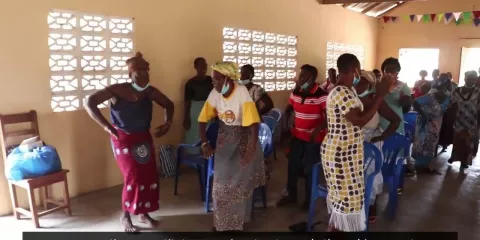
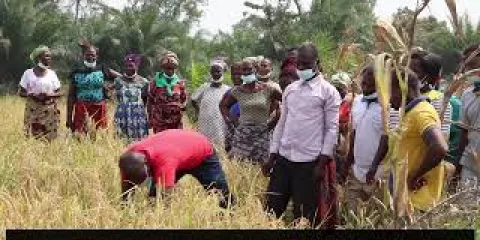
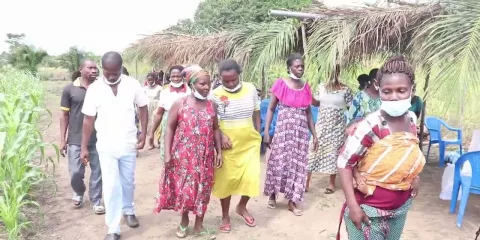
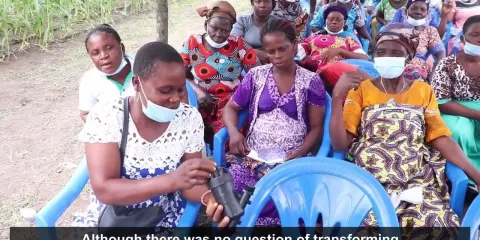
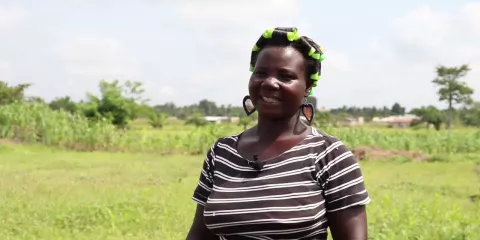
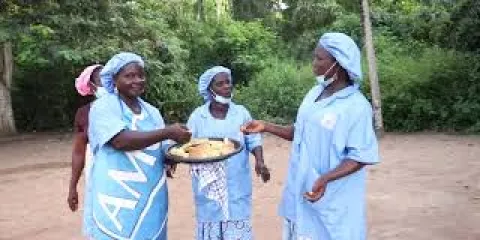
Farmer Field Schools
 14 July 2025 - 18 July 2025
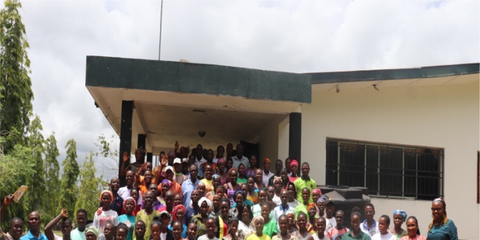 19 May 2025 - 21 May 2025
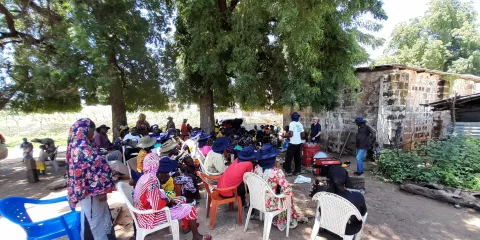 24 September 2023 - 30 September 2023
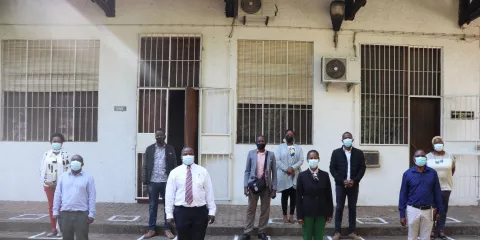 12 July 2022 - 17 July 2022
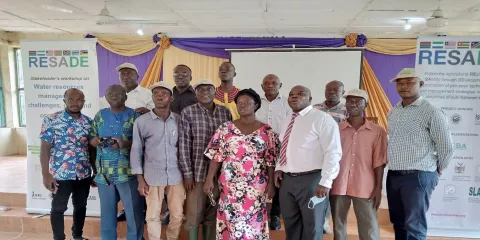 24 May 2022 - 26 May 2022
 25 April 2022 - 28 April 2022
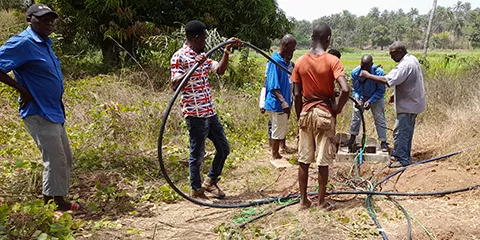 1 March 2022 - 4 March 2022
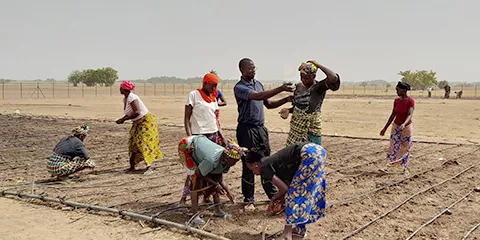 22 February 2022 - 24 February 2022
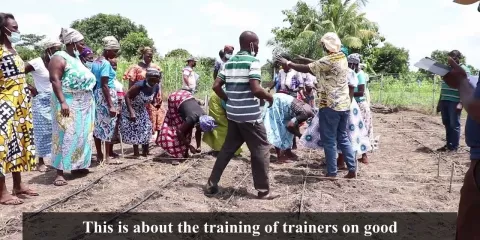
Training of Trainers
12 July 2022 - 17 July 202224 May 2022 - 26 May 202225 April 2022 - 28 April 20221 March 2022 - 4 March 202222 February 2022 - 24 February 2022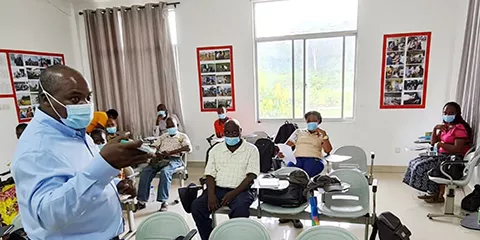 7 June 2021 - 11 June 2021
 31 May 2021 - 4 June 2021
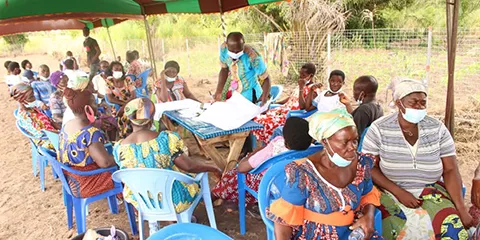 24 May 2021 - 28 May 2021
Manuals


Component 3
Scaling up of climate-smart and salt-resilient agriculture from BPHs to the farming communities in targeted areas.
Component 4
Learning, knowledge management and policy dialogue.